Jackpot Lottery Winner
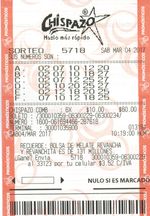
"I played the recommendation... and I won the first prize!"
See the winning lottery tickets of magayo Lotto users
A scoreline shows who leads, not how the lead happened. Mobile betting screens can present live matches as video, moving diagrams, timelines, shot maps and statistical graphs. When checking in-play events through the 1xbet apps, scores and odds provide the basic reference points, while an accompanying visualization can reveal a different part of the game. Each format answers a particular question, and none can predict the next result.
"I played the recommendation... and I won the first prize!"
See the winning lottery tickets of magayo Lotto users
A live stream shows player movement, defensive positioning and the pace of a contest. In football, a team might keep possession without moving into dangerous areas; the picture reveals that distinction more clearly than a possession percentage. In tennis, video can show whether a player is struggling to reach wide serves before that weakness appears in the score.
Broadcast rights determine which fixtures can be streamed inside a betting app. Streams also have delays, particularly on mobile connections. A goal may already be reflected in live odds while the video still shows the preceding attack. Video is therefore useful for understanding play, but not for assuming that a market remains open.
A two-dimensional pitch or court tracker converts recorded events into moving markers. Football versions may illustrate attacks, corners, shots and ball location; tennis versions can identify the server and the point in progress. These graphics work on a small screen without requiring a continuous video feed.
Their weakness is precision. An icon marking an attack does not reproduce every pass or show how much space a defender left open. Updates depend on the underlying event feed, so the animation can also lag behind the real action.
A tracker is most useful when paired with a few checks.
Does the graphic show recorded events or reconstructed movement?
Is the scoreboard synchronized with the event shown?
Has the in-play market been suspended since that event?
Those questions matter most during quick changes of possession and short-duration markets.
An event timeline places goals, cards, substitutions, breaks of serve or other incidents against the match clock. Rather than showing the action continuously, it records what changed and when. A football match at 1–1 might look evenly balanced until the timeline reveals that one team received a red card before conceding.
For betting on corners, cards or the next goal, the sequence provides essential context. However, a timeline normally shows selected incidents, not every unsuccessful attack. A quiet stretch of the timeline does not prove that neither side created opportunities.
Visualization
Live video
Animated tracker
Event timeline
Shot map
Momentum graph
Best at showing
Movement and positioning
Current phase of play
Order of key incidents
Location of attempts
Changes in pressure
Main limitation
Broadcast delay
Simplified action
Omits routine play
Needs chance context
Model-dependent values
In football and basketball, a shot map places attempts on a diagram of the field or court. Two teams can register eight shots each, yet their chances may differ greatly if one shoots mostly from distance while the other reaches dangerous areas. Some maps add expected goals or shot outcomes, although coverage varies across competitions.
For live totals and scorer markets, locations add context that a raw shot count cannot provide. Still, an attempt from close range is not automatically a goal, and a map may not show the defensive pressure on the shooter. A penalty and a long-range effort should not be treated as equivalent scoring chances. The chart describes chances already created, not guaranteed future scoring.
Momentum charts turn recent attacking activity into bars or curves across time. Several consecutive peaks may indicate that a team is spending longer in threatening areas, even when the score remains unchanged. They are especially readable on phones because the direction and duration of a trend appear at a glance.
The values are estimates produced from selected data, not an official measure of which team will score next. Different models can rate the same passage of play differently. One spike may represent a single attack; a longer sequence deserves closer examination alongside shots, substitutions and the clock.
The most useful visualization is the one that answers the market's specific question. A card timeline cannot replace video, and a momentum graph cannot replace the score. Fast-moving graphics may encourage repeated wagers, so betting is best kept recreational and within comfortable limits.
See the winning lottery tickets of magayo Lotto users
See the awards for magayo Lotto software
Download magayo Lotto software
magayo Lotto software is FREE. It is also digitally signed and 100% safe & clean.