Jackpot Lottery Winner
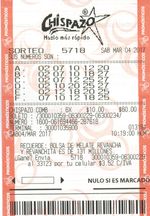
"I played the recommendation... and I won the first prize!"
See the winning lottery tickets of magayo Lotto users
Ten draws, twenty draws, forty draws. All three periods can be used in lottery analysis software, and each produces its own statistical report. The settings are described in the program's technical documentation. The longer periods are calculated from the same historical archive, rather than from a separate collection of results.
There is a parallel in football betting research. A forecast might be checked against historical odds, but the figures must belong to the correct match and date. A comparison involving bızbet would therefore need the original quoted prices, rather than figures reconstructed from completed matches. A list of final scores would be no substitute for those records.
"I played the recommendation... and I won the first prize!"
See the winning lottery tickets of magayo Lotto users
Lottery software allows the analysis to stop at a date earlier than the latest draw stored in its database.
The published instructions for historical lottery analysis describe this setting under the program's analysis parameters. It allows earlier calculations to be compared with subsequent results.
An archive may contain a recent draw, but selecting an earlier cutoff keeps that result out of the calculation. The following draw can then be examined against the figures produced at the selected date.
This does not make the forecast correct. It gives the analyst a record of what the method reported using the earlier information.
A series of these comparisons is more informative than selecting one successful prediction from an archive. Unsuccessful results belong in the record as well.
The software documentation gives a specific illustration of its analysis periods. With a ten-draw interval, short-term calculations use blocks of ten draws. Medium-term calculations use twenty, while long-term calculations use forty.
The program also works backward through earlier blocks. A ten-draw setting therefore does not mean the analysis is restricted to the latest ten results.
That detail is easily lost when historical frequencies are quoted without describing their source.
The reports contain several measurements:
These are descriptions of previous draws. A number might appear repeatedly in one short block and rarely in another.
In a fair lottery with independent draws, an earlier sequence does not alter the mathematical chance of a particular number appearing next. A frequency report can document an unusual run without establishing that the run will continue.
Mark Dixon and Stuart Coles worked with English football results from 1992 to 1995. They also had bookmaker prices from the following season, giving them a separate set of figures against which to examine their estimates.
Their 1997 paper in the Journal of the Royal Statistical Society used Poisson regression, but the calculations did not treat a club's form as something fixed from one season to the next.
A team might have scored regularly two years earlier and struggled more recently. Counting all those matches without considering when they were played could give an unhelpful picture of its current scoring record. Dixon and Coles incorporated changes in team performance into their model.
Lottery draws do not contain opposing teams or changing player lineups. Their probabilities can be calculated from the game rules, provided the draw is fair and the rules remain unchanged.
Football models must estimate scoring rates before calculating possible results. That introduces uncertainty which cannot be resolved by collecting final scores alone.
Dixon and Coles also examined bookmaker quotations. Those prices were separate observations, not figures calculated afterward from the final scores.
The difference becomes clear with decimal odds. A quotation of 2.50 corresponds to a raw implied probability of 40%. It does not establish a margin-free probability, and it says nothing about the price available at an earlier moment.
The issue is unchanged when betting information is viewed on a phone. Historical comparisons covering mobile betting access through bizbet download still require dated quotations for the exact fixtures and selections being studied.
A home-win price cannot be compared with a draw prediction. Nor can an in-play quotation stand in for the price offered before kick-off.
A historical betting study needs the records behind its figures. Dixon and Coles used match results and bookmaker quotations, while accounting for changes in team performance.
Lottery analysis works differently. Draws are recorded in sequence, and software can calculate results using an earlier cutoff.
The settings chosen during research also matter. If several observation periods were tested, the report should identify which calculations were attempted and retained.
Without that record, successful predictions may appear stronger than the evidence warrants. Omitted trials could explain much of the apparent accuracy.
See the winning lottery tickets of magayo Lotto users
See the awards for magayo Lotto software
Download magayo Lotto software
magayo Lotto software is FREE. It is also digitally signed and 100% safe & clean.