magayo Pick Software Documentation

Analyze & Recommend

magayo Pick can intelligently recommend you a smaller pool of digits to play and the filters to use based on the identified trends and patterns.

With a smaller pool of digits to play, your odds of winning will be improved. By applying the right filters, you can further narrow your play and increase your chances of getting the right winning combination in your ticket!

Various statistics are also available in both tabular and graphical formats for those who may like to analyze the game. To help you with your ease of analysis, trends and patterns identified by magayo Pick are also presented and highlighted.

Click the "Analyze & Recommend" button in the main magayo Pick window to go to the Analyze & Recommend window.

How It Works

In any lottery game, there are trends that you can identify to help you improve your chances of winning. These trends vary for different games and it will also vary over time for the same game.

To look for trends, you will need to identify the minimum and maximum thresholds for a fixed time bucket, or number of draws, over a period of time by iterating into the history of the game.

The minimum threshold is the most frequent lowest occurrence while the maximum threshold is the most frequent highest occurrence.

Any digits below the minimum threshold are likely to be drawn in the coming draws while any digits above the maximum threshold are unlikely to be drawn in the next draw,

magayo Pick will recommend to you the optimal time bucket to use in the analysis. This time bucket varies for different games depending on the number of digits and the number of numbers drawn in each draw. magayo Pick will then iterate into the history of the game to look for the trends. In each iteration, magayo Pick will identify the minimum and maximum thresholds based on the defined time bucket.
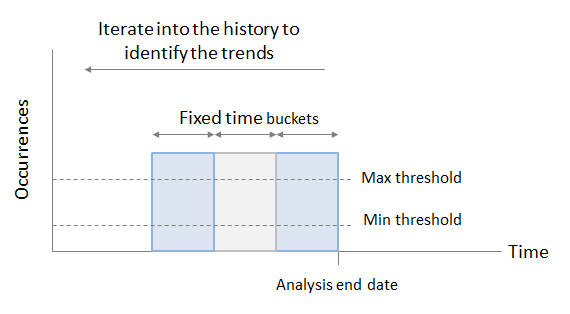
Identifying trends in lottery analysis

For example, if the time bucket is set at 10 draws, magayo Pick will look at the statistics based on 10 draws in each iteration, starting from the most recent draw to 10 draws ago. In the next iteration, magayo Pick will look at the next 10 draws in the past.

Hence, it is important to note that if the time bucket is 10 draws, it does not imply that magayo Pick only uses the last 10 draws in the analysis because magayo Pick will iterate many times into the history of the game.

The defined time bucket is used in the Short Term analysis. The Medium Term analysis uses twice the number of draws in the Short Term analysis and the Long Term analysis uses twice the number of draws in the Medium Term analysis.

For example, if the time bucket is set at 10 draws, the Short Terms analysis uses 10 draws as the time bucket, the Medium Term analysis uses 20 draws as the time bucket and the Long Term analysis uses 40 draws as the time bucket.

Besides looking for the thresholds, magayo Pick will also analyze the patterns in the different statistics to identify the maximum lapse and maximum consecutive draws.

The maximum lapse is the most frequent longest number of draws since the same digit in a specific position is drawn again while the maximum consecutive draws is the most frequent successive draws in which the same digit in a specific position is drawn.

Any digits with lapse above the maximum lapse are likely to be drawn in the coming draws while digits above the maximum consecutive draws are unlikely to be drawn in the next draw.
Analysis Parameters

This function allows you to define the parameters to be used in the analysis. Configuring the parameters is only possible in the Pro Edition.

We recommend that you use the default parameters as these values are automatically set by magayo Pick based on the rules of each game and the number of draws in the database.

Under the "Parameters" tab, select the prizes to include in the analysis. This selection is only applicable for games that have more than 1 number drawn in each draw.

Select the number of draws to be used as the time bucket in the Short Term analysis.

The recommended time bucket is set as the default value. If there are insufficient draw results in the database, a constrained time bucket will be used as there are not enough historical draws for magayo Pick to iterate and identify the trends.

The time bucket is set to "10" in the Free Version.

As explained in the earlier section, if the time bucket is 10 draws, it does not imply that magayo Pick only uses the last 10 draws in the analysis because magayo Pick will iterate many times into the history of the game.

You can further select the date for the analysis to end if you would like to test the analysis and then compare your analysis against the actual drawn numbers. The default date is the current date. This implies that the analysis will end on the most recent draw in the database.

By changing the analysis end date to be earlier than an existing draw in the database, you can test and compare the results of the analysis against the actual numbers drawn in the very next draw after the analysis end date.

If you would like magayo Pick to recommend less digits, you can select the "Recommend less digits" checkbox.

Click the "Analyze" button to proceed with the analysis.

Should you need to change the parameters and analyze again, it is necessary to exit from the "Analyze & Recommend" window first. This is a conscious design as we do not encourage you to continuously analyze using different parameters. By doing so, you will likely be overwhelmed by all the data, become confused and have difficulty deciding on which digits to include in, or eliminate from, your pool of play.

We recommend that you decide on your parameters first, analyze once and then proceed to play your selected pool of digits.

Once the analysis is completed, you can view the analysis under the different tabs.

Select Analysis to View

This parameter under the "Parameters" tab allows you to view the different analysis and it is only enabled after the analysis by magayo Pick is completed.

The different analysis are as follows:

Digit Frequency
Shows the number of times each digit in the selected position is drawn.

Digit Lapse Frequency
Displays the number of times drawn for digits in each position and in each lapse interval. Lapse is defined as the number of draws since the same digit is drawn again.
For example, a lapse of 0 implies that the digit was drawn in the specified position in the most recent draw.

Odd Even Frequency
Shows the number of times drawn for each combination of odd and even digits drawn in a draw. This analysis allows you to decide on the filters to use.

Low High Frequency
Shows the number of times drawn for each combination of low and high digits drawn in a draw. This analysis allows you to decide on the filters to use.
The digits 0 to 4 are low numbers while the digits 5 to 9 are high numbers.

Root Sum Frequency
Shows number of occurrences for each root sum of the numbers drawn. This analysis allows you to decide on the filters to use. Root sum, or digital root, is the single digit value from 1 to 9 obtained by repeatedly summing the digits in the number drawn until a single-digit number is reached.
For example, the number "368" has the root sum = 3+6+8 = 1+7 = 8.

Sum Frequency
Reflects the number of occurrences based on the sum of the digits of the number drawn. This analysis allows you to decide on the filters to use.
For example, the number "368" has the sum = 3+6+8 = 17.

Front Back Frequency
Shows the number of times drawn based on the first 2 digits (Front 2), last 2 digits (Back 2), first 3 digits (Front 3) and last 3 digits (Back 3) of the numbers drawn. This analysis allows you to decide on the filters to use.

Straight Frequency
Shows the number of times drawn for an exact match of each number.

Box Frequency
Shows the number of times drawn for all permutations of the numbers drawn. This analysis is not available for games with 6 digits due to the long processing time to calculate all the permutations and show the statistics.

In each analysis, you can click the "Export Statistics" button to export the statistics under the "Statistics" tab to a CSV (comma-separated) file. You can also click the "Export Pattern" button to export the patterns under the "Pattern" tab to a CSV file. You can open the CSV file using Excel or any text editor.

Select Position to View

This parameter under the "Parameters" tab allows you to choose the position of the digit to view. This applies to the Digit Frequency and Digit Lapse Frequency analysis. It is only enabled after the analysis by magayo Pick is completed.

Select Front or Back to View

This parameter under the "Parameters" tab is only applicable for the Front Back Frequency with the options Front 2 Digits Frequency, Back 2 Digits Frequency, Front 3 Digits Frequency and Back 3 Digits Frequency depending on the number of digits in the game. It is only enabled after the analysis by magayo Pick is completed.

Select Period to View

This parameter under the "Parameters" tab allows you to view the Short Term analysis, Medium Term analysis or the Long Term analysis. It is only enabled after the analysis by magayo Pick is completed.

Recommended Digits

Based on the selected parameters, magayo Pick will analyze every statistics, eliminate those digits that are unlikely to be drawn in the next draw and recommend you a smaller pool of digits to play. The recommended digits are shown in Red under the "Recommended Digits" tab.

The accuracy of the recommendation is dependent on the number of draws in the database as well as any changing trends and patterns.

The original odds of winning, the reduced odds based on the recommended digits as well as the improvement in the chances of winning are also calculated and shown.

The recommended digits are automatically set us the pool of digits to play under the "Select Digits" tab.

We recommend that you leverage the recommended digits as your starting point in selecting the digits to play.

Statistics

The "Statistics" tab shows you the detailed analysis in a tabular format.

The first column in the table shows the statistics which can be the digits, lapse interval, odd and even combinations, low and high combinations root sum, sum, front 2 or 3 digits, back 2 or 3 digits, straight or box, depending on the analysis that you have selected to view.

The second column "ST Min" shows you the minimum threshold identified in the Short Term (ST) time period.

The third column "ST Freq" shows you the frequency or occurrences in the Short Term period. Any data at or below the minimum threshold are highlighted. Data that are at or above the maximum threshold are also highlighted with a different color. You can personalize these colors in the Settings function in the Pro Edition.

The next column "ST Max" shows you the maximum threshold identified in the Short Term time analysis.

The rest of the columns essentially shows the same information for the Medium Term (MT) and Long Term (LT) period.

You can click on any column header to sort the statistics in ascending or descending order based on the column that you have clicked.

Chart

The "Chart" tab presents the statistics for each analysis and selected time period in a graphical chart.

The chart is not available for the Front 3 Frequency, Back 3 Digits Frequency, Straight Frequency and Box Frequency because there will be too many bars. If the chart is shown, it will not be clearly visible and meaningful.

Pattern

The "Pattern" tab shows the pattern for each analysis through the Long Term horizon.

The maximum consecutive draws and the maximum lapse identified in the Short Term horizon are also shown at the bottom of the window. The Short Term period is used for identifying the maximum consecutive draws and the maximum lapse because patterns usually change continuously over time.

The pattern is not available for the Front 3 Frequency, Back 3 Digits Frequency, Straight Frequency and Box Frequency because there will be too many columns. If the pattern is shown, you will need to scroll horizontally and vertically and it will not be user-friendly.

Current Lapse

The "Current Lapse" tab shows the current lapse for each digit in each position, which is the number of draws passed since the digit in that specific position is drawn.

For example, a lapse of 0 implies that the digit in the specific position was drawn in the most recent draw while a lapse of 1 means that the digit was drawn in the previous draw.

You can click on the column header to sort the statistics in ascending or descending order based on the column that you have clicked.

Box

The "Box" tab shows the statistics for the Box Frequency, which is the number of times drawn for all permutations of a number. The "Box" and "Description" columns show the number of permutations for the number.

You can click on the column header to sort the statistics in ascending or descending order based on the column that you have clicked.

Select Digits

The "Select Digits" tab allows you to select or de-select any digits from your pool of play.

The pool of digits to play are automatically defaulted to the recommended digits. Selected digits to play are highlighted in Red. You can click on any digit to toggle the selection.

The "Select All" button allows you to select all digits while the "Clear All" button will de-select all digits.

Filters

The "Filters" tab allows you to select the filters to use when generating the tickets based on your selected digits.

Filters are extremely useful in helping you generate tickets with the right combinations to further improve your chances of winning.

The use of filters is disabled in the Free Version.

First Prize Lottery Winner

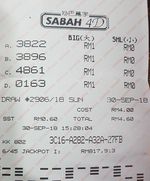
Malaysia Sabah 4D First Prize winning lottery ticket

"The number came 1st Prize... Recommended to all to try out this app."

magayo Pick software user

See the winning lottery tickets of magayo Pick users

Download magayo Pick software

magayo Pick is also available as an Android app

Always play intelligently and responsibly!

magayo.com is verified safe by Google Safe Browsing

magayo.com is verified safe by Norton Safe Web